Wednesday, January 21, 2009

Geography and Images....We Can't Do Without Them

Geography teachers are always on the lookout for photos and images (I know that we cannot live without them). Sometimes, finding that particular image to prove your point, show that process or add to your presentation is so important and necessary for your lesson. You then spend the next few hours trawling Google Images or another search engine to find what you are looking for. Well, say goodbye to that! The great thing about the internet and Web 2.0 is that everything, and particularly searching, has become much more time efficient.

A very intelligent person (I have no idea who, someone from Germany apparently) has created Tag Galaxy. Tag Galaxy uses images from Flickr (a site where anyone can upload images) and categorises them for easy searching according to the tags they are given when the images are uploaded. This is done visually, as well as allows the user to determine more advanced searches by clicking specific categories. It has been very well received in the IT world, receiving this review 'Flickr Visualisation Tag Galaxy: Out of this World' from Mashable: All That's New on the Web.

Below are a series of screen snapshots from the Tag Galaxy search I did on 'Geography' and ending up at 'Mountain Landscapes'.

Step One - Go to Tag Galaxy and type in your search word.

Step Two: The following screen will appear. Choose your sub-topic. In this case I chose 'Mountains' then 'Landscapes'.


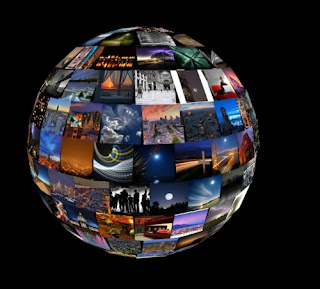
Step Three: Select the centre 'ball of fire' and the screen below will appear. (It may take a little while to load depending on the number of images, but looks very cool as it does!)

Step Four: Select your images by clicking on the particular photo. You can spin the photo ball with the hand. When your image appears, click on it again for a better view. You can also go to the particular Flickr site to acknowledge the photographer, as well as view other photos they have taken.


Another option, though created differently is 'Earth Album Alpha - A Slicker Google Maps + Flickr Mash-up'. This site allows you to select a country and any images tagged to the country on Flickr appear. Double click on the image for a better view and the comment written by the person who uploaded the photo. The site regularly up-dates according to new images that are added to Flickr. A screen capture example for India is below.


Check these sites out. I promise that you will find great images in half the time for your lessons! Add the sites to your student resource lists as they will also find them very useful when creating Geography Projects. Just make sure you acknowledge the person who posted the image on Flickr. Also, some school internet servers may block Flickr, so that would be a handy question to ask before your lesson.

Have fun playing!

Gapminder: Statistics in Motion

Teaching human development and population in Geography can be tough when trying to find and then display up-to-date statistical data. I have also found that showing this data in a clear and relevant way that students understand and relate to can also be difficult. In 2007 I discovered the TED site, a site devoted to talks presented at the annual TED conference. These talks are on a variety of innovative ideas and thoughts. One of my favourite talks by a doctor called Hans Rosling, introducing a program he developed called Gapminder.

Hans Rosling is professor of international health at Karolinska Institutet (KI), the medical university in Stockholm, Sweden. He began his career as a doctor and spent many years in rural Africa. He leads courses on global health in both undergraduate and postgraduate programs. To enable students and researchers to make sense of the world development he started Gapminder, a non-profit IT-company. Gapminder aims to dispell common myths about the so-called developing world. He uses statistics from United Nations data that is illustrated by visualisation software to present the data in a way that is clear, and understood. As well as this, he is a very entertaining and funny presenter. His first talk introducing Gapminder at the TED conference in 2006 is below.


The Gapminder website also includes gapcasts, short videos explaining specific types of data and the relationships between this data. A blog, as well as downloads and the ability to upload any of the data used is also available. Rosling also posts flash animations on specific topics such as 'Who has the best teeth in the world?' and 'Who has the most oil?'.

Following the success of Gapminder, Rosling developed Dollar Street. This downloadable flash animation contains complete photo-panoramas from households at different income levels. As stated on the site 'All people of the world live on Dollar Street, the poorest to the left and the richest to the right. Everybody else lives in between'. The current version contains 13 households and 3 school documentations from Mozambique, South Africa and Uganda. The second talk below was delivered at TED in 2007, when Hans Rosling unveiled Dollar Street.


Gapminder is an amazing resource for the classroom. I recommend that you bookmark this site and add it to any resource list you give to your students when studying development. You could also create specific handouts for the students to complete in class.

Tuesday, January 20, 2009

Google Street View: People Might Be Watching

Google Street View would have to be one of the most exciting and controversial developments in mapping software at the moment. When Street View was launched in August, 2008 (the map to the left shows Street View coverage in Australia) there was quite a bit of controversy over the privacy issues. Articles including 'All-Seeing Google Street View prompts privacy fears' from Times Online and 'Google Zooms in Too Close for Some' from the New York Times, indicate the main privacy issues. There are also a number of sites and blogs now specifically related to the quite private (and funny) images that Street View can produce. One such example is Street View Fun, a site where contributors can upload the latest funny and interesting Google Street View Photos. Uploaders to You Tube have also jumped on the Street View bandwagon, this posting 'Part 1 of 'The Googling' by a group called The Vacationeers, is one of my all time favourites.


Google Street View does have competition. Since it waltzed onto the spatial technology scene in spectacular fashion, a number of other similar applications are now available. These include Mapjack (picture above), City8 (invented and launched in China 1 year prior to Google Street View), iiCosmo (developed in Japan), Earthmine (developed for private companies and involved in 3D modelling for NASA) and EveryScape. Of these, Earthmine did catch my attention due to the sophisticated nature of the software. Check out the site and the posted news articles. Also, EveryScape was interesting as it is based on the tourist industry, and allows the user to investigate inside buildings and major tourist attractions. The You Tube post of the EveryScape launch is below.


I am sure that you can see the applications these street view sites have for us in the Geography classroom. I have often used Google Street View as an introduction to Geography or mapping in junior classes (a new twist to the standard Year 7 'map your neigbourhood class activity') and it is invaluable when looking at human environments and town planning in senior geography. Now that I have discovered EveryScape, any tourism studies can now be enhanced. In essence, *almost* any location you study or discuss in class, can now be viewed in a whole new way.

For those who are the more technically minded among us, check out the Official Google Maps API Blog. This will explain, in some detail, how to embed a Google Street View Panorama onto your own blog or website (or even your school!). Information and a demo on how to do this is provided for you.

Monday, January 19, 2009

What Really Is Geography These Days?

Yesterday I began planning my first semester of Year 11 Geography. I have allowed the first week to introduce and discuss the idea of 'What Geography is?' before launching into a study of natural environments. Introducing the concept of what geography actually involves is quite different to when I was at high school, or university, or even when I first started teaching.

This is due to the fact that geography and location has become such an important part of organising information on the internet. Rather than searching for a fish and chip shop in the yellow pages, you go to Google Maps, type in 'fish and chip shop' and see which are closest to you. At a recent conference, the keynote speaker quoted that 80% of all information on the internet is now organised spatially. This will only increase as more and more data is added.

An example of spatial organisation of data is a site called '80 Million Tiny Images'. This is a visual (and spatially organised) dictionary of all nouns in the English language. The nouns are arranged by semantic meaning; they are clustered according to broad categories such as plants or people, and then tighter groupings such as flowers or trees. These semantic groupings allocate their spatial location on the page. The creator even uses the word 'map'. A large number of images are then linked to each word. Simple click on the 'map' and the word with associated images will appear. You will notice that they are clustered together according to spatial location and relationships, rather than alphabetically.

Another example is a site that has been put together by marumushi. Marumushi is a design engineer who has an interest in playing with and visualizing lots of data. His site 'Newsmap' is an application that visually reflects, according to category and location, the changing landscape of world news. The map dispalys and reveals patterns in news reporting across countries and the the nature of the most popular headline at the time. This site is great to use in senior geography, to discuss events that have occured, if they have been reported on, and by which countries. You are able to look at a global view, or specific countries such as Australia, the US and the UK. The differing colours on the site represent different news categories, and the larger the writing, the more it appeared in news headlines.

Finally, a third site that organises data and information in a spatial way is 'Buzztracker: World News, Mapped'. Buzztracker is a software that visualizes frequencies and relationships between locations appearing in global news coverage. It is also great as it shows how interconnected the world is. "Big events in one area ripple to other areas across the globe. Connections between cities of thousands of miles apart become apparent at a glance". You will need to remember however, that this site only tracks English-language news sources. A link is provided to add buzztracker to your own site, something to think about putting onto your Geography blog or wiki at school.

These are only three of the many tools that allow you to search or organise information according to spatial location. Others include Tag Galaxy, Arc, Kartoo, Flickr, News Spectrum, Bigspy, Stack, Swarm, Think Map Visual Thesaurus, Google News Cloud and Searchme Visual Search. These are all great sites so take the time to check them out.

The You Tube clip below was a great example of the way in which many of the tools listed above represented the Iraq War. Have a look...


So, to introduce my class to Geography I will use my stock standard content and activities. But I will also emphasise the role of geography and location in organising information, the role geography plays in our everyday lives, and how we are becoming more and more reliant on spatial organisation of information.

That should get some minds thinking.....

Saturday, January 17, 2009

Why Societies Collapse? - Jared Diamond


For Christmas in 2005 Santa struck the jackpot and left a great book on Christmas morning. This book was 'Collapse: How Societies Choose to Fail or Survive', by Jared Diamond. He also wrote 'Guns, Germs and Steel' which can also be found as a three part documentary that first aired in 2005.

So, I got stuck into the book, reading the Prologue: 'A Tale of Two Farms' and then jumping straight to Chapter 13 - 'Mining' Australia'. To this day I still have not read the entire book, but have used it as a great reference in my senior Geography classes. Some of the text and video available is particularly useful when looking at sustainability and biodiversity, as well as introducing any form of environmental studies. One reason that the book is great is that Diamond is quite controversial in his opinions on the role of environmental degradation in the collapse of society. Upon receiving and reading the book Dad (a farmer and climate change sceptic) and I would argue well into the night over a cup of tea about Diamond's theories and examples.

He analyses past and present societies according to a five-point framework. This five-point framework includes:
1. Damage that people inadvertently inflict on the environment
2. Climate change
3. Hostile neighbours
4. Decreased support of friendly neighbours
5. How does a society respond to these problems?

Trawling through the TED website yesterday, I found the 2005 talk by Diamond, outlining his beliefs in the collapses of differing societies. His talk is a little complex, however it refers to so many different examples and would be useful to introduce development or a case study on countries such as Zimbabwe. The other great thing about TED is that you can read the comments of others in the blog. These comments make great questions that you can challenge your students with following the viewing of the vodcast.


Diamonds article 'What's Your Consumption Factor?', appearing in the New York Times on January 2nd, 2008, is also a very good article to use with your class. Happy viewing!

Friday, January 16, 2009

NASA Earth Observatory

The NASA Earth Observatory website is on my top ten list of useful websites for a Geography teacher. Every image of the day is spectacular, and is a great discussion tool to introduce a lesson. The following article 'Earth Observed' from The Big Picture, highlights 20 spectacular satellite images taken from the Earth Observatory. I have chosen three of my favourite satellite images below as an example of what is available.


The picture above is one of my favourite. The image was taken by ASTER, one of NASA's Terra satellites on October 12, 2004. It is an image of the southeastern Fars province in southern Iran. As you can see, a large river moves through the arid regions, and then spreads out into an alluvial fan. Of course, the broad belt of agricultural land is obvious. Teaching rivers is great with images like this.


This image is also a definite favourite. It was taken by Ikonos, a commercial satellite on the 27th June, 2002. This forest, divided into quarters by two dirt logging roads (orange roads) is located in the northern Republic of Congo, Africa. Satellite images were collected to attempt to create a map of logging roads and forest disturbance across tropical African Forests.

And finally...


This satellite image was also taken by the commercial IKONOS satellite in September 2004. However, that is where the similarity ends. These are the houses and streets of Las Vegas in Nevada, USA. The settlement patterns themselves are amazing, and could really be any major city in a developed country around the world. Check out the pools as well... and think about what was here prior to urban sprawl and development...

How Google Is Making Us Smarter...

I found this article 'How Google is Making Us Smarter' from the DISCOVER Magazine on Metafilter (a great site by the way), and had a read. It is interesting as in the first two paragraphs it tackles the debate that technology (mobile phones, internet etc) is making us 'more stoopid'. I have always struggled with this argument as I believe our students are much more street smart when it comes to finding and using relevant information, as well as utilising technology and particularly the internet for their needs. In particular, the article looks at the 'extended mind', and the argument that our environment is often an extension of our mind. We need both to be successful, and the internet, and indeed technology is part of our environment.

Rather than arguing that too much technology in the classroom is 'dumbing down' our students, maybe we should be more worried about the school environment as an extension of student minds. Maybe we should also consider that we need to prepare students to utilise this ideal more and more in the future.

To end this post, something quite poignant at the end of the article....

Socrates worried that writing would make people forgetful and unwise. Sure enough, writing did rob us of some gifts, such as the ability to recite epic poems like The Iliad from memory. But it also created a much larger pool of knowledge from which people could draw, a pool that has continued to expand.

Imagine the world without writing... That is definitely something for us to all think about....

Wednesday, January 14, 2009

Gotta Love Google Earth

This morning I was putting together some documents on how to use Google Earth for teachers and came across this article outlining how software developers have enabled a person on a Wii Fit to virtually surf around the world. (Surf the Planet Using Google Earth and the Wii Balance Board). This is pretty amazing itself, but the applications of this for Geography students is pretty amazing... Imagine spending a Geography lesson surfing, and learning about the differing types of coastlines... I can.


And then the next link 'Google Earth launches online Prado Art Gallery' added another dimension to the use of 3D imaging in Google Earth. If this can be done for art, imagine what else users can look at.. Pretty exciting really. The You Tube Fly through is below.